
Lousy Weather 2012
Feb 1, 2012: Welcome back to another exciting episode of "Complaining-about-something-that-you-can't-do-anything-about-and-will-have-to-get-used-to", also known as "Lousy Weather".
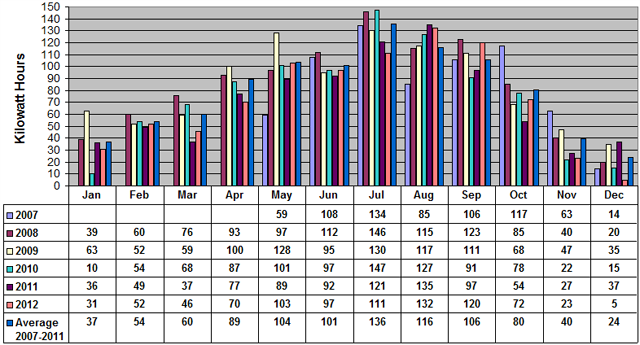
We last left off with December 2011's total, which, surprisingly, wasn't all that bad. I guess there isn't much to complain about this time, either. The chart shows that it was a not-too-bad month for PV production. In fact, if you consider that the average production total for January is somewhat skewed due to first an extreme high in 2009, and then an equally extreme low in 2010, things might have been not-quite "normal" (I always put that word in "quotes", what is "normal" anyway?).
Being a leap year this time around, February might not be all that bad, an extra day could make all the difference. So far, it's OK, so we'll see. Wonder what I'll do if the rest of the year turns out to not be so bad, weather-wise? Maybe rename this topic title??
Feb 29: Yes, I may have to start calling this "Average Weather 2012". The February figures look quite normal.
March 31: OK, so "normal" goes out the window this month. Average production would have been 60 KwH, but the lack of sun cut that back to 46. It didn't help that we had a five-and-a-half-day utility power outage as the result of six inches of wet snow one evening. I operated off-grid for that period, and did very well, but any production above the little that I allowed myself to consume (not knowing how long the power would be out) was wasted. As it was, I weathered the power failure fine, and there wasn't much sun during anyway.
Yep, I am SO ready for some Spring weather, bring it on!
April 30: Another record low production month. Oh yay. I'm actually beginning to see referrals in my site statistics where people have searched goggle for "Why is the weather so bad" and gotten this page in their results. I don't know why, I just know I'm real tired of it.
June 1: Amazing! A monthly total that equals the average, even though the average is inflated due to May 2009 being exceptionally high. The average does not include May 2007, because the PV's and balance-of-system equipment were not fully installed until late in the month, so that total is artificially low.
June 30: I'm having trouble believing that every June has been as cloudy and rainy as this one, but the numbers this month come in so close to average that it's not worth quibbling about.
July 31: Cloudy mornings for the last two weeks resulted in an excessively low production total, although it's been kind of nice not having heat in the middle of the day as a result...
Aug 1: A second-place showing for August's production, but that figures, as the weather has been very sunny and not too hot. High temperatures cause the PV modules to "derate", or put out less power than when cool.
Note that the total for August 2007 is artificially low due to the system being offline for a week or so due to my construction and installation of a diversion load controller to send excess power production to the water heater.
Oct 3: The total for September was the second highest for this month yet. The weather has continued mild and clear, so lots of photons colliding with electrons inside the PV panels, and producing power.
Nov 1: A close-to-average month. October started off great, full summer-like weather, but on the 12th, someone up in the sky clicked a switch and it turned into winter, been rainy most every day since.
Dec 1: Nothing much to tell, the second-lowest production total since I've been keeping track, a month filled with rain.
Jan 4, 2013 Happy New Year. After Dismal December, things can only get better. The end of the old year was filled with rain, snow, hail and clouds, making the total PV production only 5 KwH, I had to stretch out the PV-vs-Utility graph in order to get the yellow and orange bars to even show up. I actually think I've made more power in the first tfour days of 2013 than I made all last month!
Since installing the PV power diversion controller, I've kept a daily log of the amounts of power diverted to the water heater. These values have been plotted against the consumption of utility power and monthly PV production for the last twelve months. The result gives a better understanding of the proportions of power produced and consumed, and presented a surprising factoid that I was kind of aware of, but not fully cognizant of: That despite varying amounts of "excess" solar power, about half of what I produce with the PV's ends up getting burned off in the water heater, regardless of the monthly utility consumption. I was aware of this on a daily basis after reading the displays, but the graph makes it very clear, about 50% of the PV ends up heating water, while the other 50% runs household loads during the daytime hours.
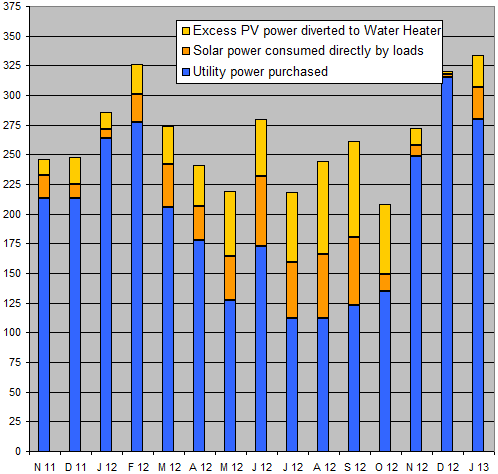
(The orange and yellow bars, taken together, represent the total of PV production for that month.)
Original material ©1996-2026 Mr. Sharkey | All rights reserved